Fig. B.1.
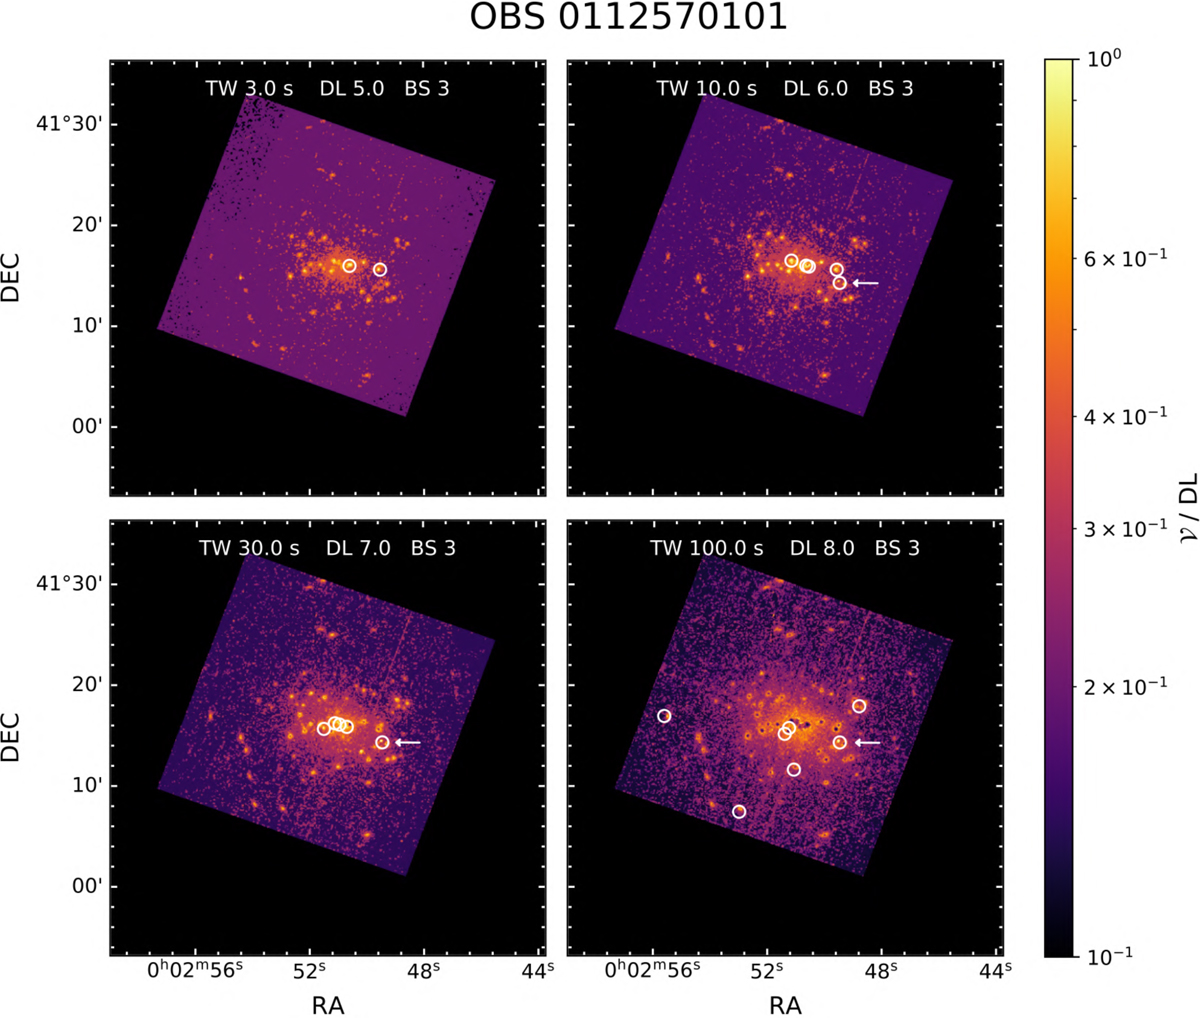
Variability of observation 0112570101 of M 31’s central region. Computed with TW = 3 s (top left), 10 s (top right), 30 s (bottom left) and 100 s (bottom right). The colorbar is the same for all the plots and represents the variability divided by the detection level used for each time window, from less variable (𝒱/DL = 0.1, darker) to more variable (𝒱/DL = 1, lighter). The detected variable sources are marked by white circles. One of the sources that is detected with TW = 100 s, TW = 30 s and TW = 10 s in this observation was reported in Pietsch & Haberl (2005) as a type I X-ray burst, and is it marked here with white arrows.
Current usage metrics show cumulative count of Article Views (full-text article views including HTML views, PDF and ePub downloads, according to the available data) and Abstracts Views on Vision4Press platform.
Data correspond to usage on the plateform after 2015. The current usage metrics is available 48-96 hours after online publication and is updated daily on week days.
Initial download of the metrics may take a while.