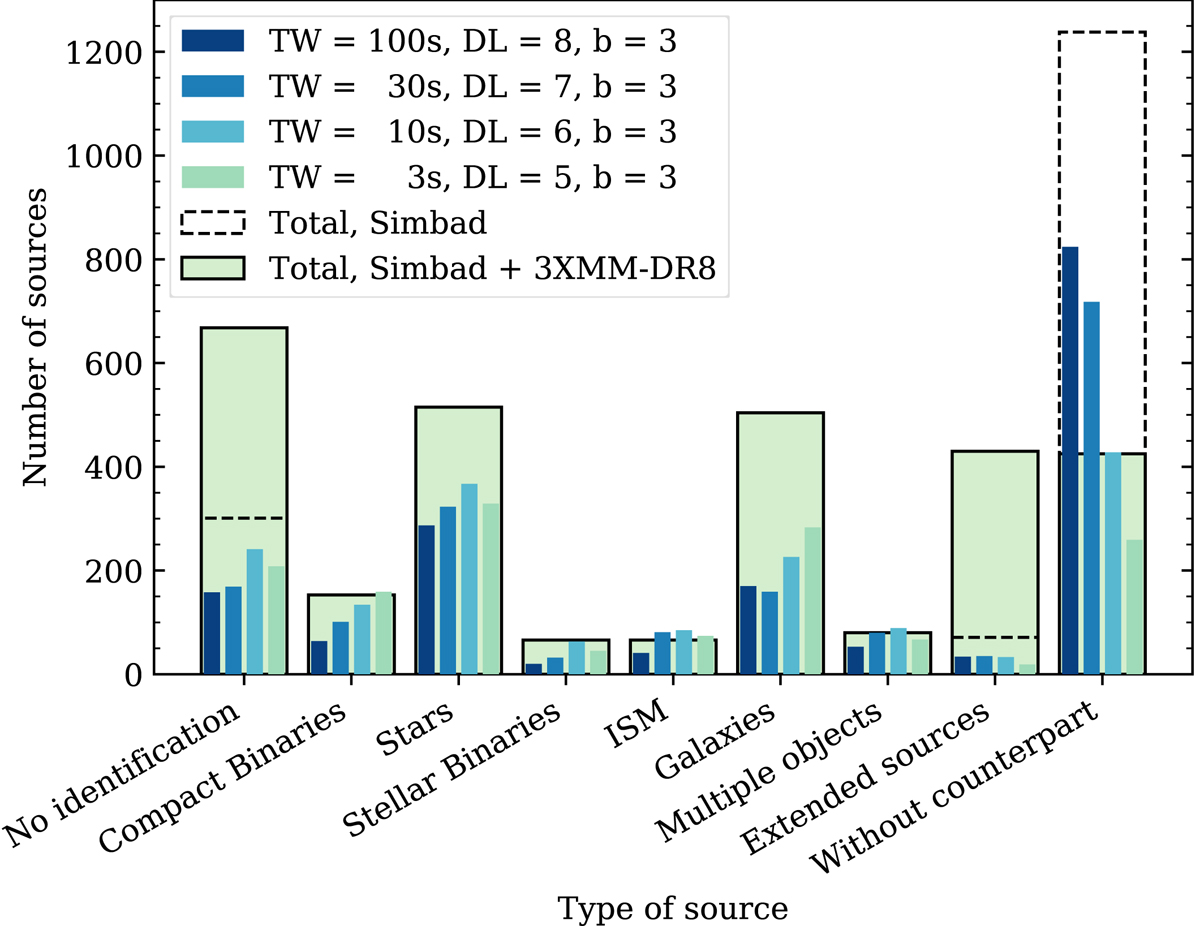
Fig. 4.

Classification of the sources detected by EXOD in source types. The thin bars show the SIMBAD association of the sources detected, from darker to lighter, with 100 s, 30 s, 10 s and 3 s respectively. The thick bars with a black dashed contour show the SIMBAD association of the grouped sources. The thick light green bars with a solid black contour show the SIMBAD association with the 3XMM-DR8 correction.
Current usage metrics show cumulative count of Article Views (full-text article views including HTML views, PDF and ePub downloads, according to the available data) and Abstracts Views on Vision4Press platform.
Data correspond to usage on the plateform after 2015. The current usage metrics is available 48-96 hours after online publication and is updated daily on week days.
Initial download of the metrics may take a while.


