Fig. 5.
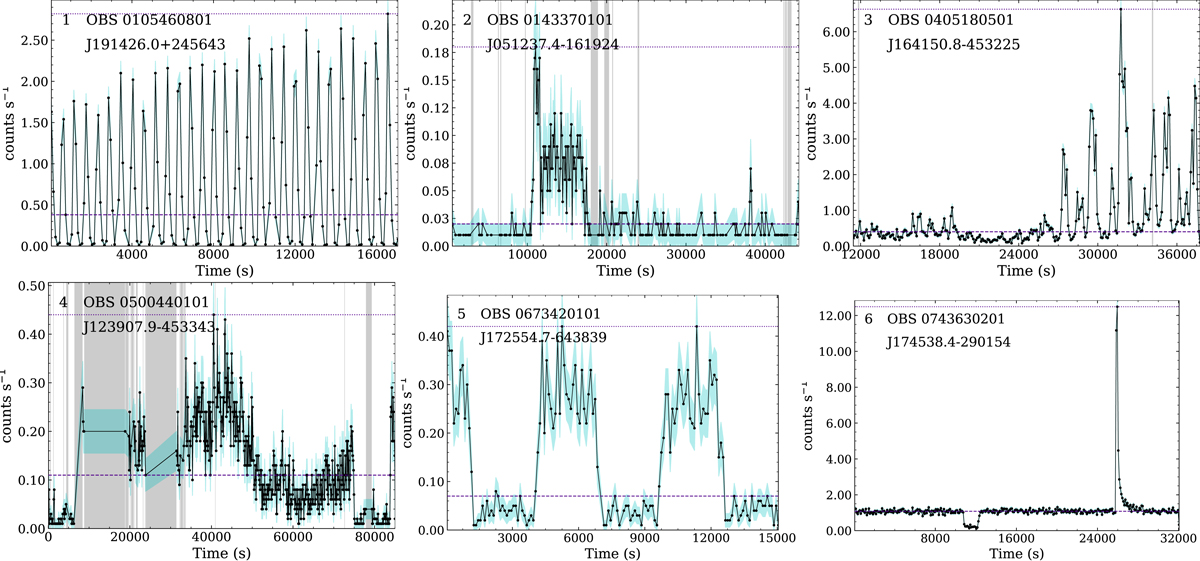
Example of light curves of sources with different types of variability detected by EXOD. The light curves are plotted in black with cyan shaded regions representing the 1σ error bars. In each plot we give the OBSID where it was detected and the 3XMM name of the source. The dashed purple line represents ![]() , the median number of counts. The dotted purple line represents 𝒞max, the maximal number of counts. The gray vertical shaded regions represent the bad time intervals. (1) RX J1914.4+2456, ultra compact binary showing periodic oscillations (Steeghs et al. 2006). (2) WISEA J051237.57-161925.2, high proper motion star showing a stellar flare (Kirkpatrick et al. 2016). (3) IGR J16418-4532, flares from a supergiant fast X-ray transient (Sidoli et al. 2012). (4) V* V1129 Cen, eclipsing binary of beta Lyr type (Bruch 2017). (5) LSQ J172554.8-643839, magnetic cataclysmic binary showing periodic eclipses (Fuchs et al. 2016). (6) AX J1745.6-2901, LMXB showing a type I X-ray burst (in’t Zand et al. 2019).
, the median number of counts. The dotted purple line represents 𝒞max, the maximal number of counts. The gray vertical shaded regions represent the bad time intervals. (1) RX J1914.4+2456, ultra compact binary showing periodic oscillations (Steeghs et al. 2006). (2) WISEA J051237.57-161925.2, high proper motion star showing a stellar flare (Kirkpatrick et al. 2016). (3) IGR J16418-4532, flares from a supergiant fast X-ray transient (Sidoli et al. 2012). (4) V* V1129 Cen, eclipsing binary of beta Lyr type (Bruch 2017). (5) LSQ J172554.8-643839, magnetic cataclysmic binary showing periodic eclipses (Fuchs et al. 2016). (6) AX J1745.6-2901, LMXB showing a type I X-ray burst (in’t Zand et al. 2019).
Current usage metrics show cumulative count of Article Views (full-text article views including HTML views, PDF and ePub downloads, according to the available data) and Abstracts Views on Vision4Press platform.
Data correspond to usage on the plateform after 2015. The current usage metrics is available 48-96 hours after online publication and is updated daily on week days.
Initial download of the metrics may take a while.