Fig. 11
Download original image
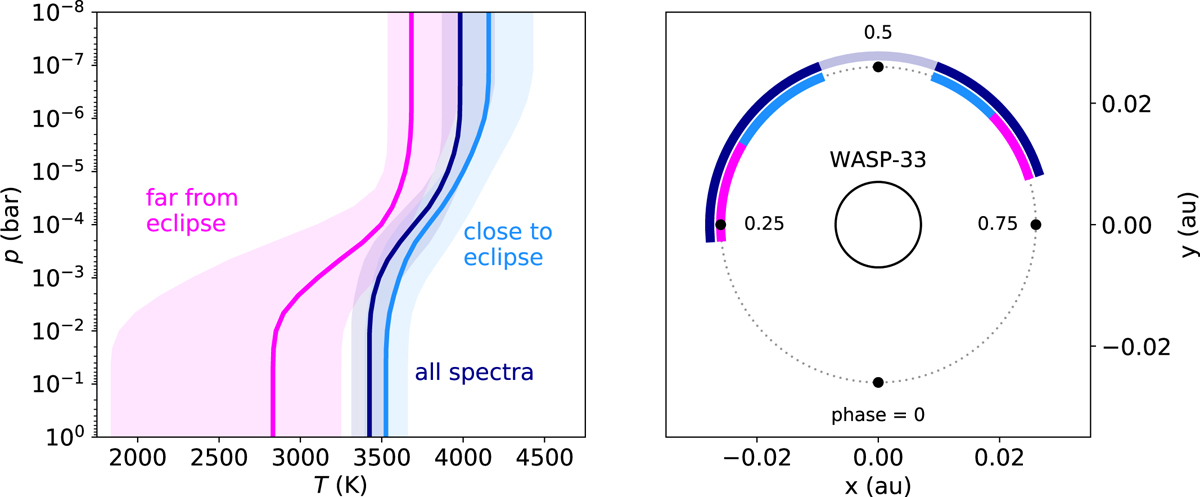
Temperature curves from the retrievals including all the detected chemical species and orbital phase coverage. Left panel: median of the sampled temperature profiles with the 1σ interval. The dark blue line indicates the temperature profile computed using all the spectra outside the RV interval ±vrotsini*. We also measured the temperature profiles by running the retrieval on two subsets of the spectral time series. The T-p profile inferred from the spectra far from secondary eclipse is indicated in pink, while that inferred from the spectra close to eclipse is in light blue. Right panel: orbital phase intervals used to compute the different T-p profiles (orbital phases in the RV range ±vrotsini* in transparent dark blue).
Current usage metrics show cumulative count of Article Views (full-text article views including HTML views, PDF and ePub downloads, according to the available data) and Abstracts Views on Vision4Press platform.
Data correspond to usage on the plateform after 2015. The current usage metrics is available 48-96 hours after online publication and is updated daily on week days.
Initial download of the metrics may take a while.