Fig. B.1
Download original image
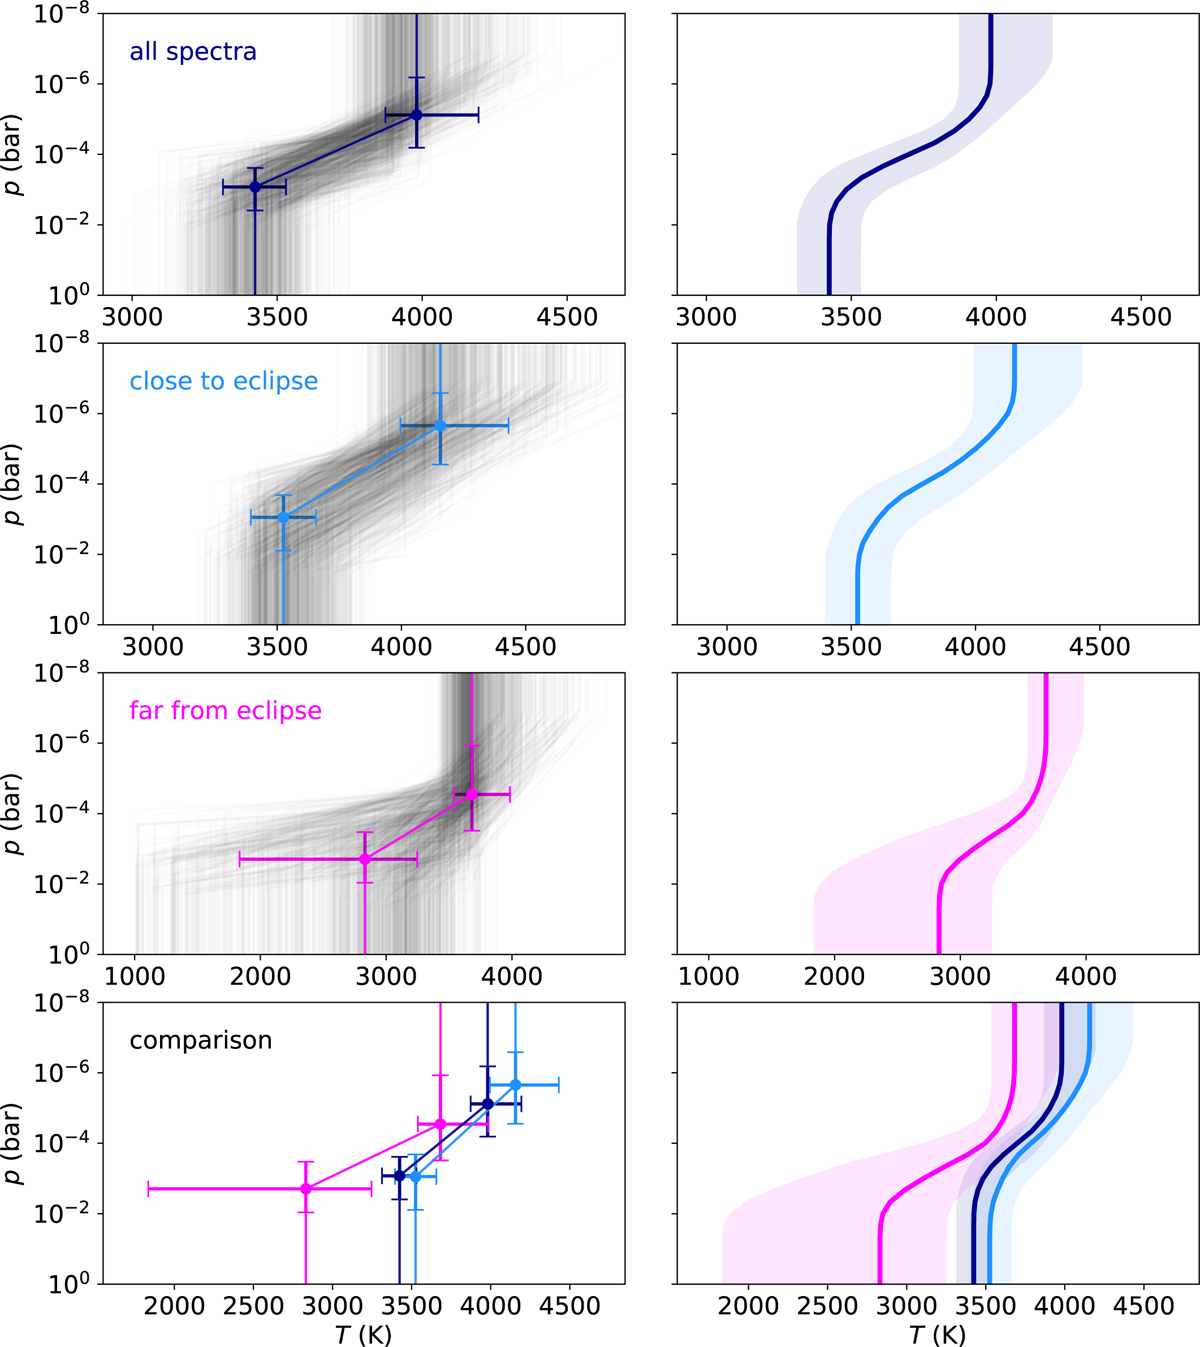
Retrieved T-p profiles using the spectral lines of all the detected chemical species (i.e., Ti i, V i, OH, Fe i, Si i, and Ti ii). The left panels show the retrieved two-point T-p profiles with the respective uncertainties. Examples of the T-p profiles that were sampled when running the MCMC method are indicated in gray. The right panels show the median of the sampled temperature profiles and the 1σ interval. The panels from top to bottom show the temperature profiles obtained using all the spectra, a subset of spectra close to the secondary eclipse, a subset of spectra far from the secondary eclipse, and a comparison of the three T-p curves.
Current usage metrics show cumulative count of Article Views (full-text article views including HTML views, PDF and ePub downloads, according to the available data) and Abstracts Views on Vision4Press platform.
Data correspond to usage on the plateform after 2015. The current usage metrics is available 48-96 hours after online publication and is updated daily on week days.
Initial download of the metrics may take a while.